English
MaixSense-A075V
Summary
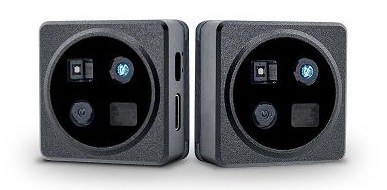
MS-A075V is a 3D TOF camera module with RGB designed by Sipeed, can display the live 3D picture.
User Guide
Preparation
To run preview MaixSense-A075V on Windows, install the driver.
Windows Installation driver tutorial:Click to view
On-page preview
Before using this device, make sure that the
192.168.233.0/24address segment is not occupied in your network environment, because the MS-A075V uses RNDIS and sets its IP addresshttp://192.168.233.1.
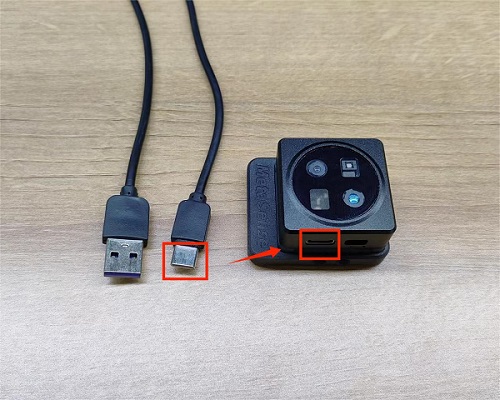
Connect the module to the PC with power according to the figure above, then the built-in fan will start to work and the red light will be displayed at the lens. Select the browser and enter http://192.168.233.1 to preview the 3D point cloud image. After power-on, the system and program will be started 10s-15s delayed.
Quick preview using web upper computer (front and side) :
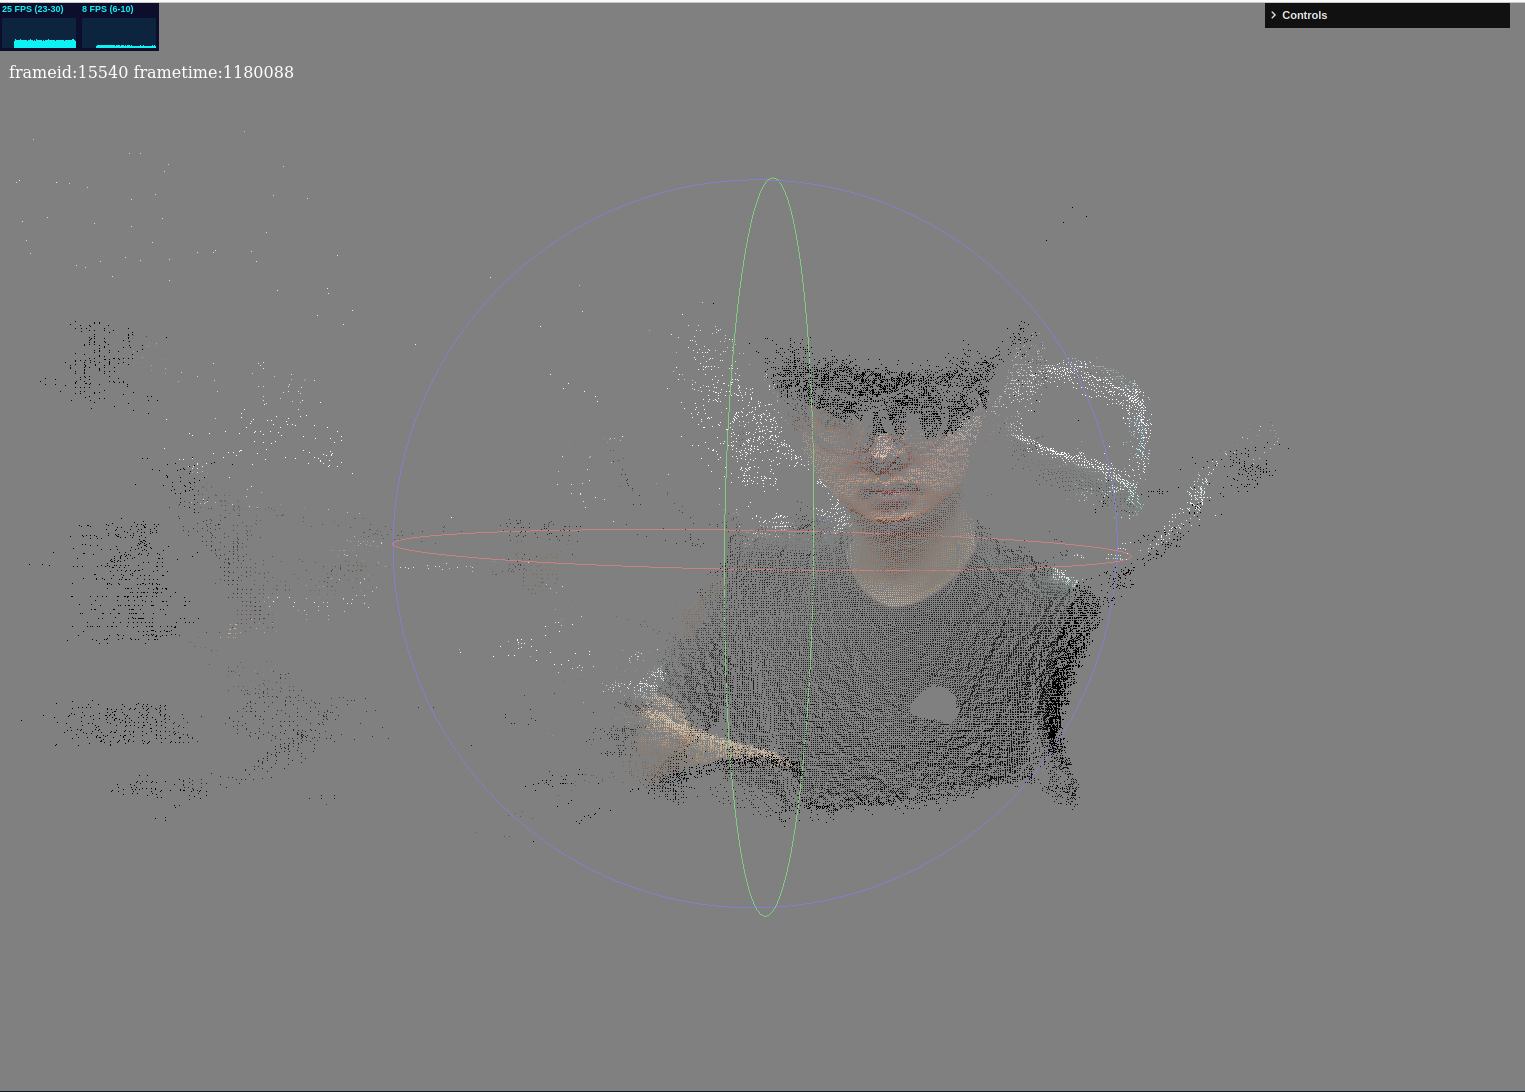
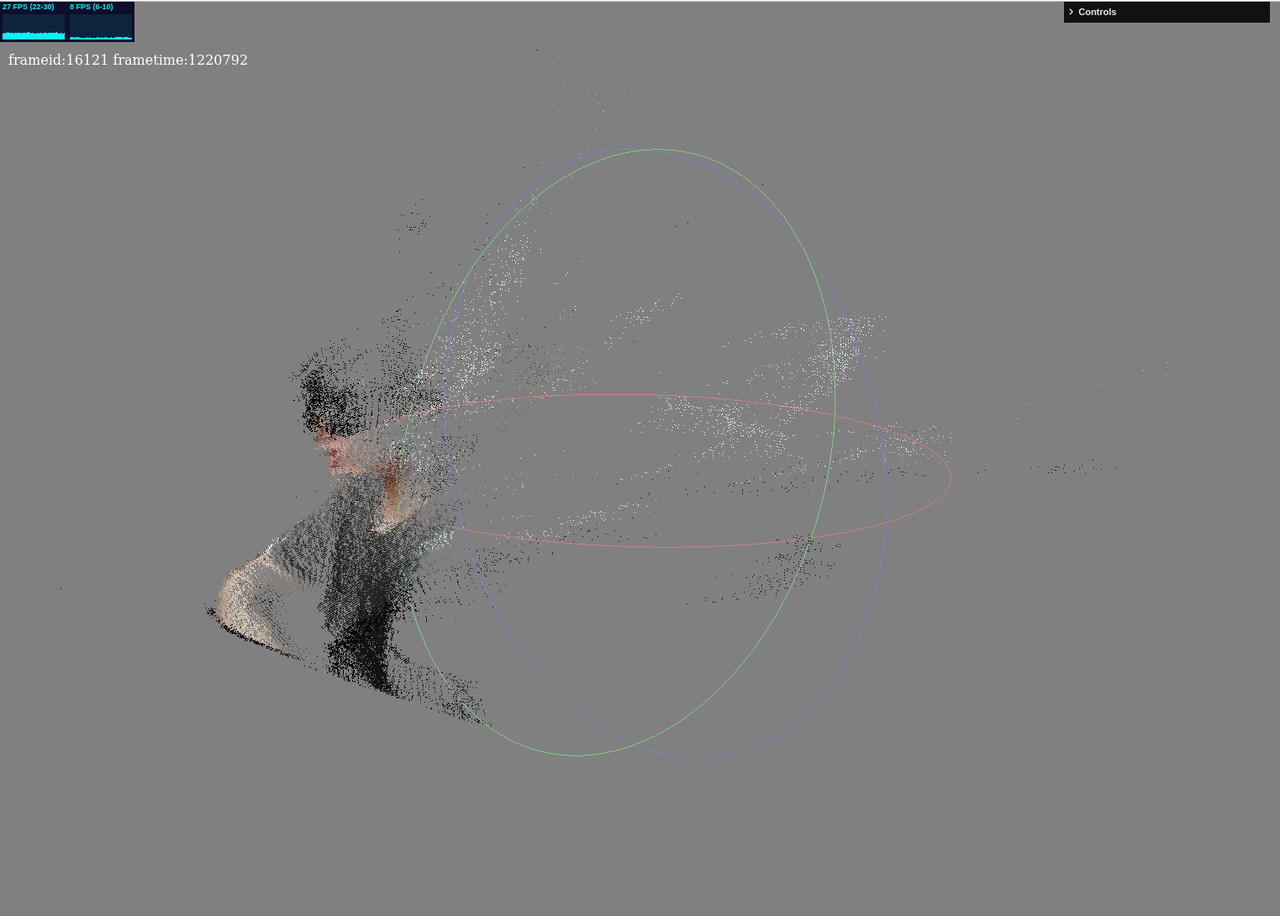
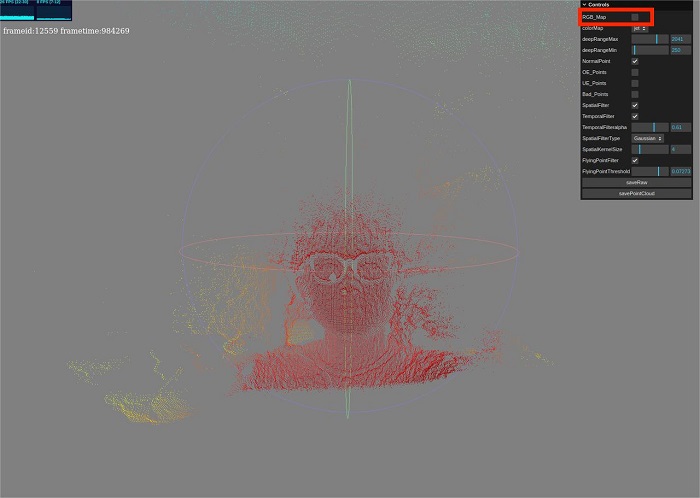
We can preview the depth pseudo-color point cloud map. Open the interaction panel in the upper right corner, uncheck RGB_Map in the first line.
Interactive configuration
The preview webpage contained many function configurations, we can change them to get different live preview result.
Here tells the functions of each widgets.
- RGB_Map checkbox, control RGB map. Display the deep pseudo-colored point map when checked, display the RGB-mapped point cloud map when unchecked.
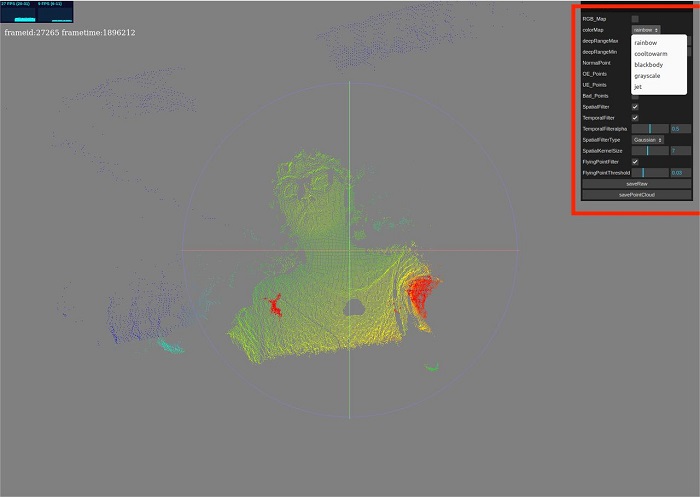
- colorMap drop-down bar, provides several pseudo-color mapping options(cmap),jet is recommended. Available when RGB_Map is unchecked.
- deepRangeMax and deepRangeMin slide bar are used for setting the mapping range of cmap, the depth value between deepRangeMin and deepRangeMax are OK. Available when RGB_Map is unchecked.
- NormalPoint checkbox, control the display of normal point(There maybe some invalidation points when TOF worked, need to do opposite action). Recommend checked.
- OE_Points checkbox, control the display of OE point. Recommend unchecked.
- UE_Points checkbox, control the display of UE point. Recommend unchecked.
- Bad_Points checkbox, control the display of bad point. Recommend unchecked
- SpatialFilter checkbox, control the Spatial filtering. Processing based on the spatialFilterSize value below and the algorithm specified by the SpatialFilterType.
- TemporalFilter checkbox, control the Temporal filtering, A time average is calculated based on the temporalfilteralpha values below.
- TemporalFilteralpha slide bar, set the time for Temporal filtering. Adjust it moderate, can be tested by yourself.
- SpatialFilterType drop-down bar, set the Spatial filtering algorithm, provides Gaussian filtering and Bilateral filtering. Bilateral filtering requires high performance, not recommended.
- SpatialFilterSize slide bar, set the range for Spatial Filter. Adjust it moderate, can be tested by yourself.
- FlyingPointFilter checkbox, control the flying point filter. Set the following FlyingPointThreshold value as the filtering threshold, those that exceed the threshold will be filtered out. Set it moderate, otherwise the validation points will be filtered out.
Save data
The webpage provides 2 buttons at the bottom of the control bar.
- SaveRaw:Save one frame raw data. If you want to use the depth data or IR or RGB data for development, you need to know the data struct of raw. We provide a detailed
jupyter notebookabout the data processing of raw for users and developers. - SavePointCloud:Sava one frame 3D point map, and its saved format is
pcd. Can be previewed via the script provided above.
Note: The data of raw can be get through open interface, which developers can do development on. While the pointcloud data does not provide any interface since it's calculated based on the raw data and camera internal parameters.
SSH login
In addition to using the web page to preview directly, we can also login using SSH with password root
In the web preview page we know the ip address of this device is 192.168.233.1, with which we can login to this device.
ssh root@192.168.233.1
Firmware Update
Replace the corresponding file in /root/maix_dist directory.
Click to download the update file
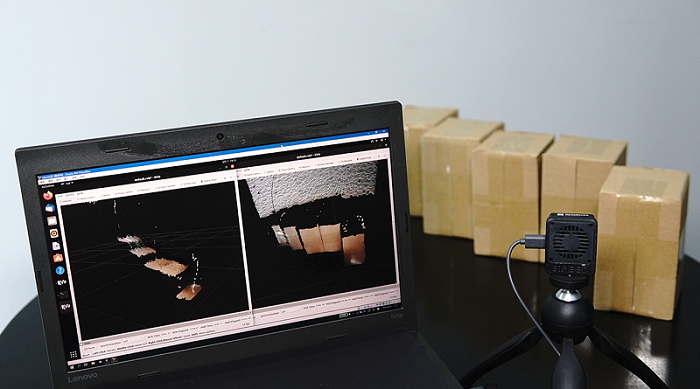
Case: Real shooting of distant, near and far point cloud
High-precision mapping of differences in object placement distances, point cloud maps can intuitively feel a more realistic visualization.
Case: Car avoid obstacles
The module can be carried by a car or drone to move back and forth to obtain the depth value of the obstacle, and judge whether there is an obstacle in the screen through the difference, make a rapid response and accurately avoid the obstacle (the example has not been open sourced, will be sorted out and disclosed).
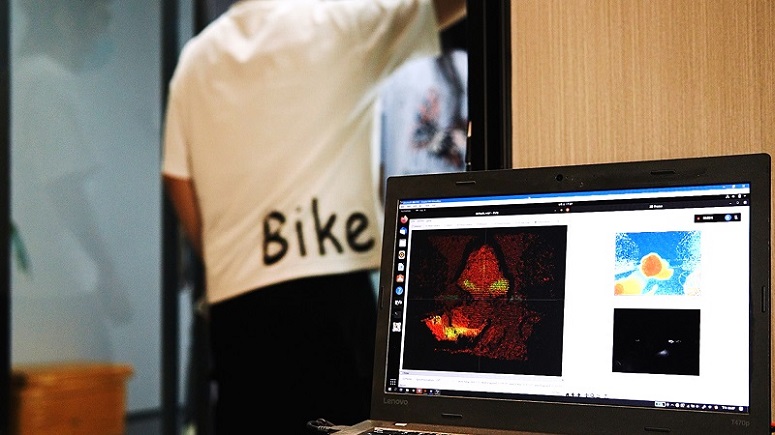
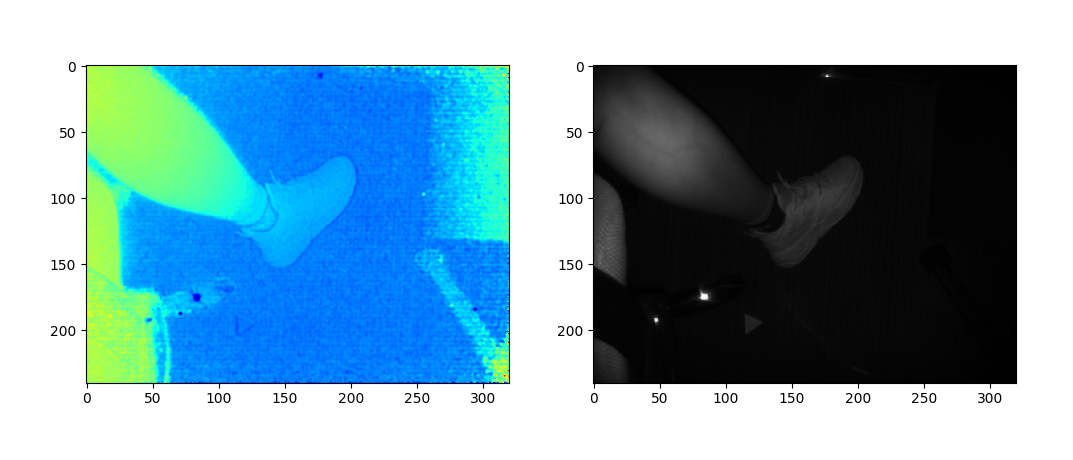
Case: Detect foot traffic
High-precision, high resolution real-time monitoring of the flow of people moving around the situation statistics(the example has not been open sourced, will be sorted out and disclosed).
Custom development
python SDK
This is a SDK based on Python3. MS-A075V opens its http interface, we can get its origin data (Depth map, ir map, rgb map) through http request.
To help user understand the struct of data package and the relevant logic of decoding, we provide decoding related functions that encapsulate http requests and native data, based on which users can do custom development.
Get SDK:Click to download
Method:Install jupyter, connect to the TOF module, then open the toturial.py file.
Decode and stream
After understanding the struct of data package and the relevant logic of decoding from Python SDK, we can do advanced development, continuously get, decode and call the third-party python image library, like matplotlib for live display. The toturial.py gives the implementation of getting onr frame data, and it can achieve live display by plt with loop.
Decoding and steraming:Click me to see content of stream.py
Methods:Run command python stream.py after installing all dependent packages.
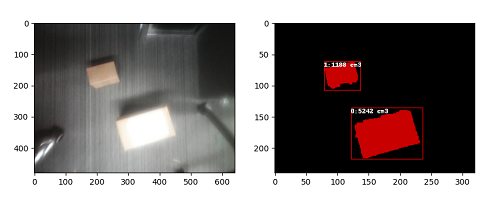
Detect volume
Based on third-party python library,and have understood the logic of getting and decoding data, we can do more development: Continuously display frames, roughly calculate the point cloud through the data from TOF module by SDK, do the accumulation to get the total volume. Limit: The top view should include all details except bottom.
Detect volume:Click to view calVolumes.py
Methods:Run command python calVolumes.py after installing all dependent packages, there will be notice after you run it.
Use ROS
To begin this, install ROS on your computer first.
Use ROS1
1. Preparation
Prepare a Linux environment for ROS.
2. Install and RUN
#Extract sipeed_tofv075-ros.zip,and open its path
source /opt/ros/*/setup.sh
catkin_make
source devel/setup.sh
rosrun sipeed_tof_cpp publisher
#Then the terminal continuously refreshes the command line
3. View frames in RQT
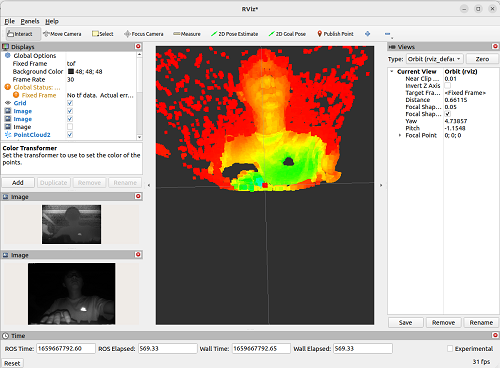
4. RVIZ preview
Open rviz2, in the bottom left interface choose Add->By topic->PointCloud2 or/depth ->Image add ->Display/Global Options/Fixed Frame, changed it into tof,
in this way it displays point cloud normally. According to the added content, the Image displays in the left and the point cloud display in the center.
Use ROS2
1. Preparation
Prepare a Linux environment for ROS.
2. Install and RUN
We have provided the functional package for ROS2, users need compile and run it on the system with ROS2.Access package download..
#Extract sipeed_tofv075_ros2.zip,and open its path
source /opt/ros/*/setup.sh
colcon build #If it indicates missing colcon, use command sudo apt install python3-colcon-ros
source install/setup.sh
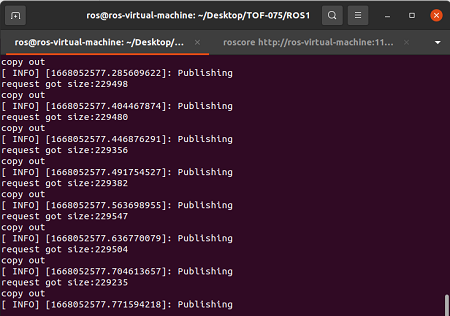
ros2 run sipeed_tof_cpp publisher
#Then the terminal continuously refreshes the command line and display [sipeed_tof]: Publishing,this means it works normally.
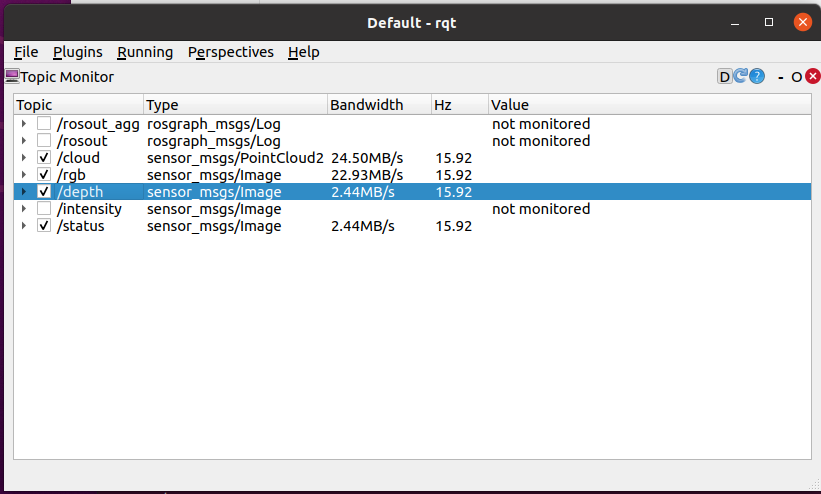
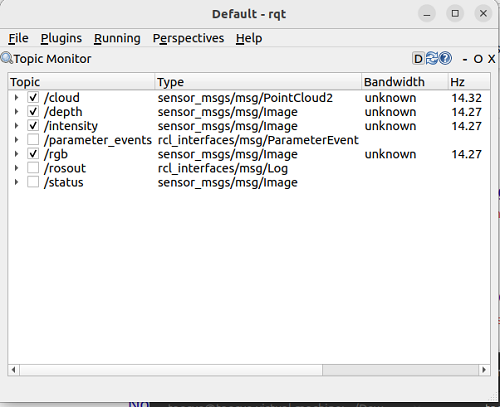
3. View frames by RQT
Open RQT and select Plugins->Topics->Topic Monitor.
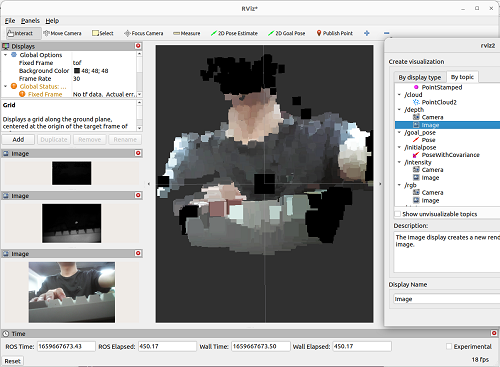
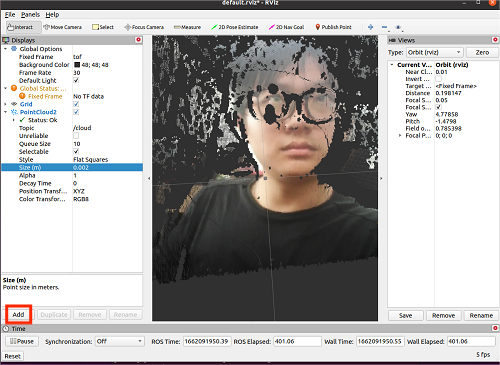
4. RVIZ2 Priview
Open rviz2, in the bottom left interface choose Add->By topic->PointCloud2 or/depth ->Image add ->Display/Global Options/Fixed Frame, changed it into tof,
in this way it displays point cloud normally. According to the added content, the Image displays in the left and the point cloud display in the center.
The result of mixing Pseudo-colored point clouds and RGB: